🗓 released June 5th
✨ New Spotlight data dashboard in Galleries
Introducing the new data dashboard of Launchmetrics Spotlight in Galleries! This new feature consists of a collection performance dashboard that provides valuable insights into the performance of your collection. Here's what you need to know:

-
🎛 Access to New or Old Data Dashboard: You can switch between the old and new data visualization interfaces. The filters corresponding to the collection season and years are preserved when switching interfaces.
-
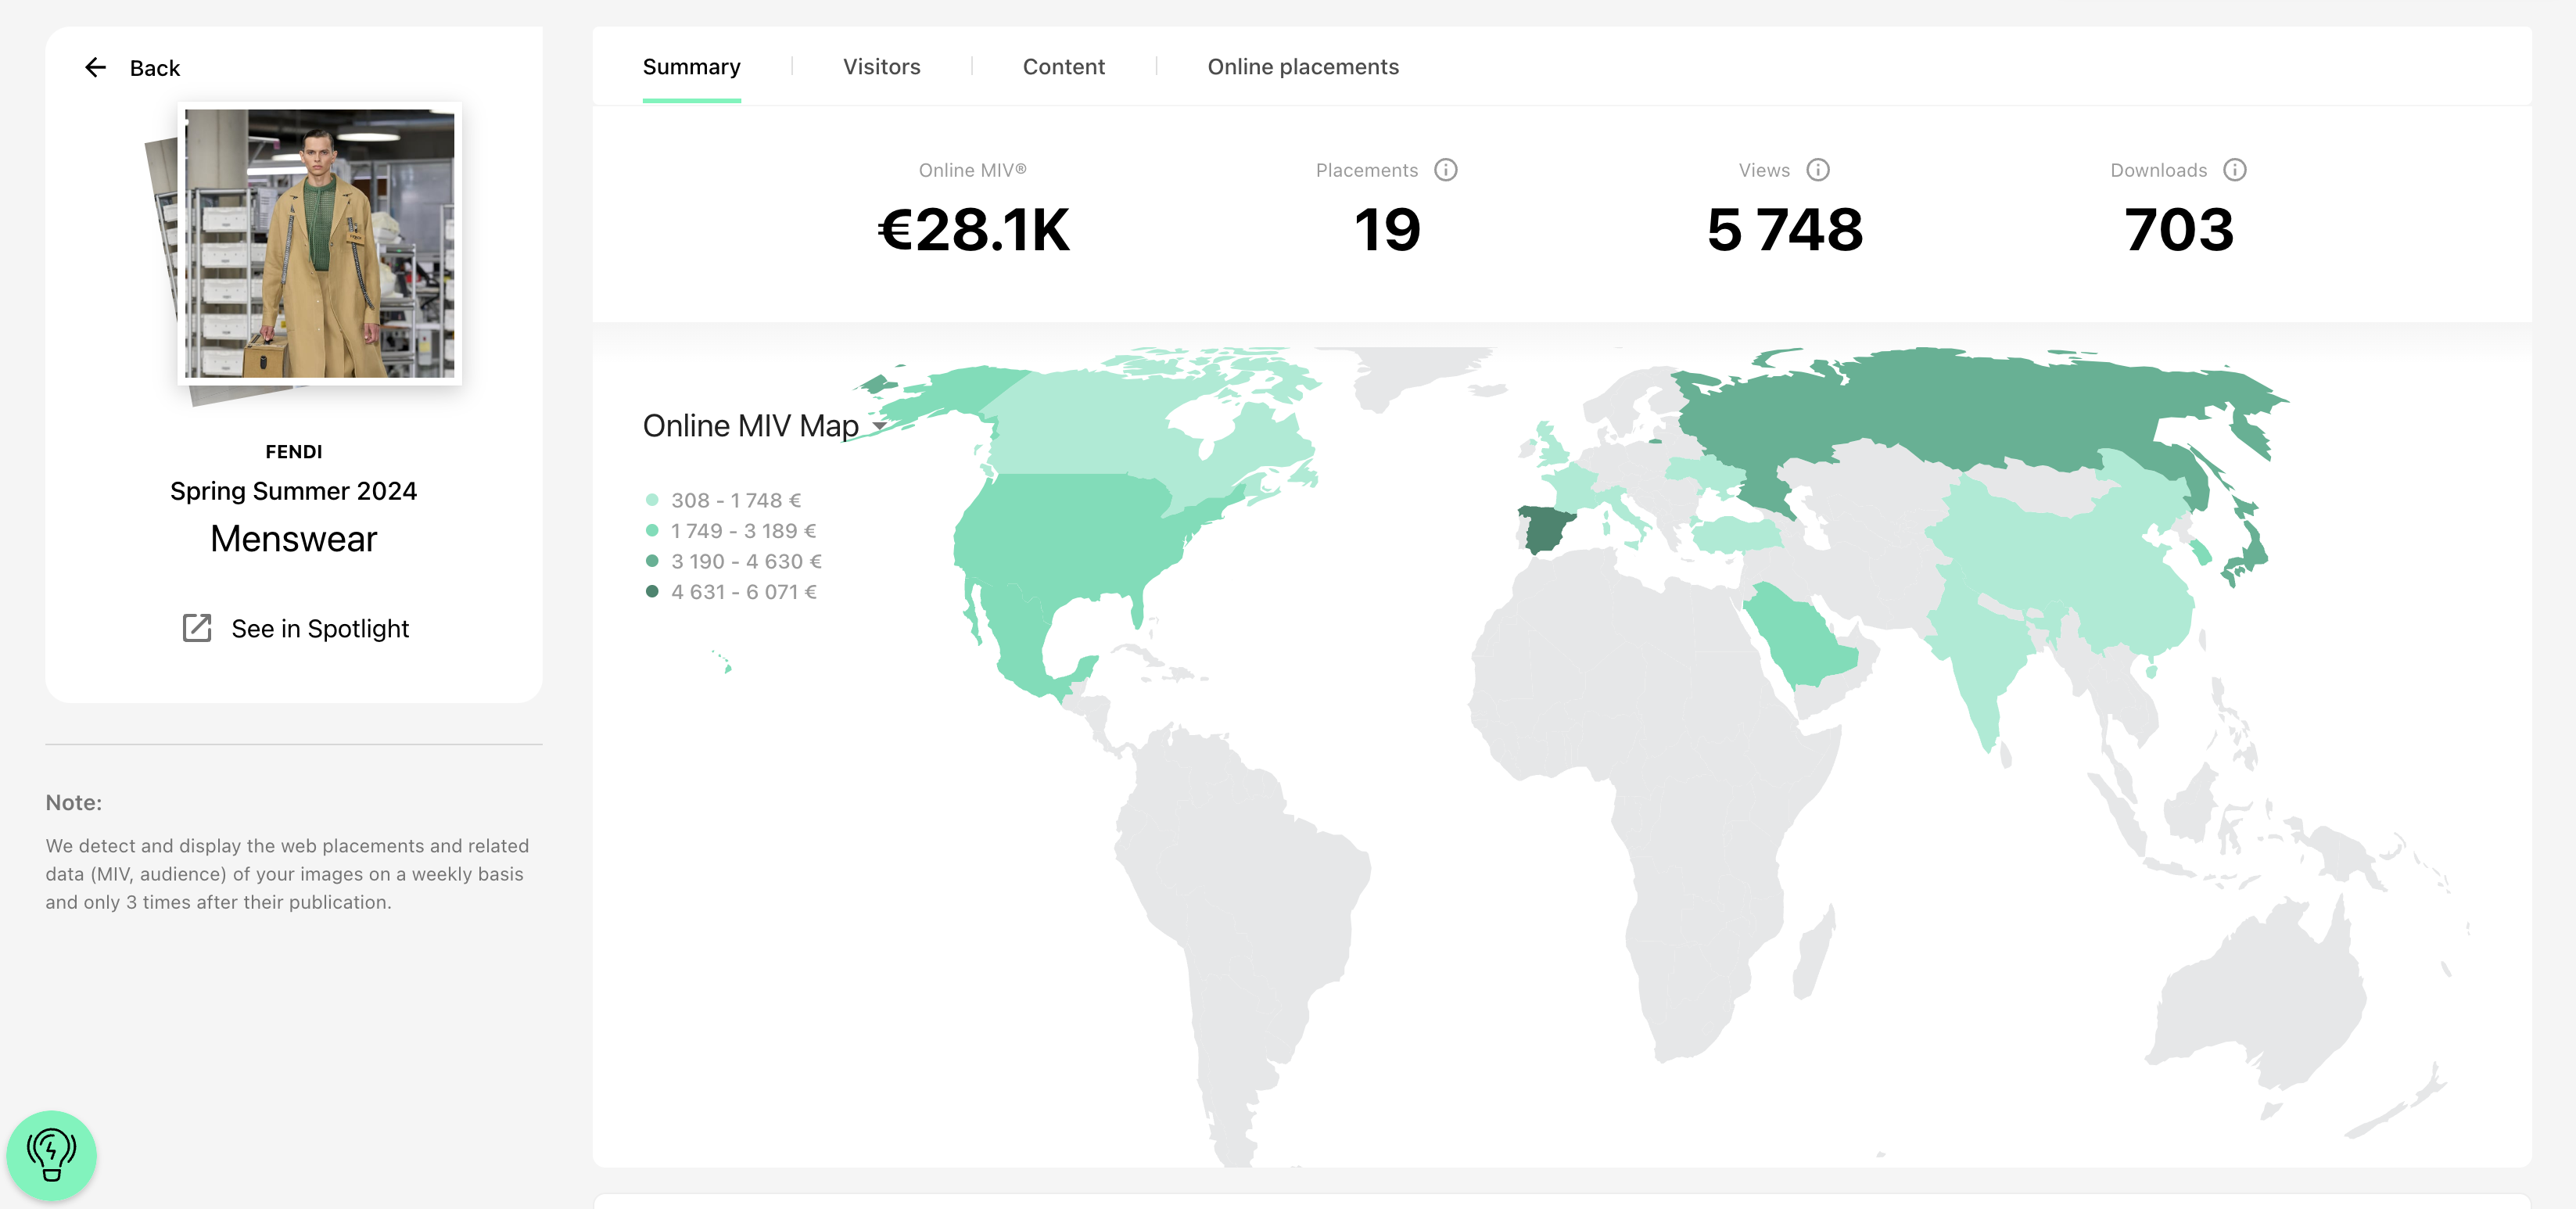
🔢 Data Introduction: The dashboard displays various metrics related to users, views, downloads, placements, and MIV (Media Impact Value). Views represent impressions of your images, while downloads indicate the total number of image downloads. Placements refer to the number of articles where your images have been detected, and MIV represents the sum of placements in euros.
-
🛸 Global Navigation: The dashboard provides easy navigation to explore the data and reports it contains.
-
🧶 Filters: You can apply filters based on date to refine the data displayed in the dashboard. The date filter allows you to select a specific time range.
- 💄 Summary Tab: The summary tab provides an overview of your collection's performance through graphs and metrics such as online MIV, placements, views, and downloads. The online MIV map visually represents performance by location, and the funnel graph displays the conversion rate of images from publication to usage in web articles. The top visual content section highlights the best-performing images, and the evolution graph shows the collection's performance over time.
The new data dashboard in Launchmetrics Spotlight provides comprehensive insights and analytics to help you understand and track the performance of your collection.
It's a powerful tool for optimizing your marketing and PR strategies.
Want to know more?
Read all of the documentation of Launchmetrics Spotlight in Galleries here: